California, if it were a country, would have the fifth-largest economy in the world, and is often described by Governor Gavin Newsom as a “nation-state.” Yet, how well is the state really doing compared to other states?
Two indices — the California Dream Index developed by California Forward and the Legatum Institute United States Prosperity Index — may hold the key to answering this question.
Both platforms were developed to provide valuable data for decision and policymakers. By tracking and measuring distinct indicators, the data can be used to identify areas of weakness and drive policy, as well as keep those in power accountable for progress or lack thereof.
The indices will be featured in a conversation, Comparing Data Dashboards, hosted by the Pepperdine School of Public Policy on March 3.
“Data can be a powerful tool for informing policy solutions and keeping decision-makers accountable,” said Pete Peterson, dean of the Pepperdine School of Public Policy and a member of California Forward’s leadership council. “How the data are used, and how they’re communicated and leveraged can be critical to changing outcomes.”
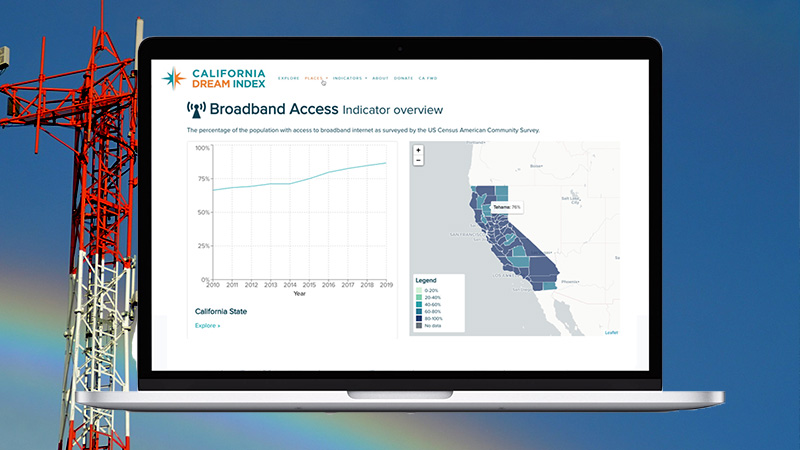
The California Dream Index tracks the state’s progress using 10 indicators connected to economic mobility, security and inclusion, which can also be broken down by race, region, educational attainment and income. The Index has shown that, despite a decade of economic growth, California has stagnated on many critical indicators like affordable rent and home ownership.
The indicators focus on concrete measures with an empirical connection to economic mobility and reflect practical questions everyday Californians face like: Is my commute too long? Can I afford to own a home or rent an apartment? Do jobs pay above the cost of living? Is the water clean to drink and air good to breathe?
Building upon its global index, which it has been producing for fourteen years, the Legatum Institute United States Prosperity Index tracks progress on 216 indicators within the three pillars of inclusive societies, open economies and empowered people. It provides a state-by-state perspective, and also focuses on addressing the long-term decline in economic and social mobility seen within the counties in California and the United States as a whole. The index is a great complement to the California Dream Index. Whereas the U.S. Index is broad and covers multiple policy areas, the California Dream Index interrogates specific areas at a deeper level, examining the extent to which communities are experiencing inequality.
In the 2020 Legatum Prosperity Index, California ranked right in the middle — 26 out of 50 states. Over the past decade, buoyed by a booming economy, California increased by nine ranks and was the most improved of all states. During that time, however California’s business environment fell two ranks and the state also dropped to last place in housing, which aligns with the findings in the California Dream Index, confirming that this is a priority issue for the state.
“The American dream of a life that combines opportunity and hard work with prosperity, stability, and wellbeing is in tatters,” said Carol Graham of the Brookings Institution. “The Legatum Institute’s newly created United States Prosperity Index provides a roadmap to help craft strategies for repairing the divides that block this dream from being realized for many Americans, often the same ones who are most vulnerable to the debilitating COVID-related shocks.”
Speaking to the value data can have in creating change, the U.S. Prosperity Index has been used by foundations in Montana to assess grant applications, as well as by the Mississippi Center for Public Policy to press the case for a repeal of laws that unnecessarily push up health costs within the state. The California Dream Index is also building a community of practice composed of regional organizations, philanthropy, and policymakers committed to using data and evidence to help inform current and future policy decisions.
Register today for the March 3 Comparing Data Dashboards conversation here.