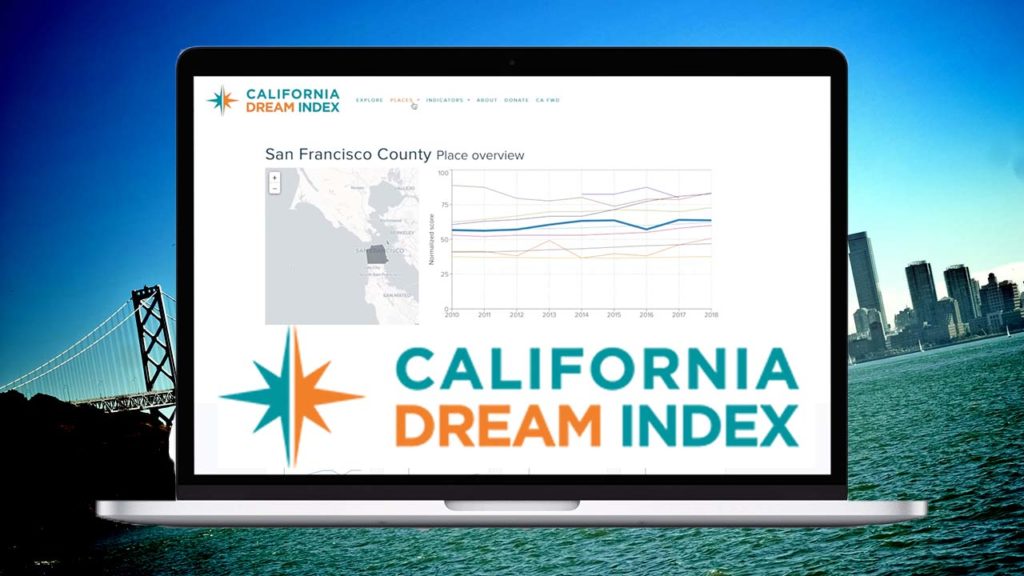
Even though California enjoyed a historic boom during the past decade, the addition of 2019 data into the California Dream Index announced today by California Forward confirms that prosperity was not experienced evenly by all Californians. The overall California Dream Index rose or stayed flat in all of California’s regions from 2010 to 2019 with the exception of the Redwood Coast which slightly declined. The Sierra Nevada Counties near Lake Tahoe saw the greatest gains during those years.
“The data show the hard reality that equity stagnated while wealth grew massively, even before the COVID-19 inequality bomb hit,” said Micah Weinberg, CEO of CA FWD. “The California Dream Index is a necessary tool as we work to reimagine an economy that is more equitable, just and sustainable for more Californians.”
Today, the state’s long-standing inequities have been exacerbated by the COVID-19 pandemic and resulting economic recession. In addition to COVID-19 impacting communities of color at disproportionate rates, women have also been among the hardest hit by the economic downturn with more women leaving the workforce or unable to find new work than men, according to the Public Policy Institute of California. Additionally, small businesses have been dramatically affected, with less than 74% of the businesses open in January 2020 still open in December 2020 according to Harvard’s Opportunity Insights.
“To meet today’s challenges, we need a tool like the California Dream Index to track indicators of economic mobility and help guide us as we build an economic recovery that is centered on both growth and inclusion,” said Dee Dee Myers, director, Governor’s Office of Business and Economic Development (GO-Biz).
The California Dream Index is a powerful platform that tracks progress over time toward the California Dream. Measuring 10 trackable indicators for economic mobility, security and inclusion, data can be analyzed by race and ethnicity, region, and county, providing the ability to do “apples to apples” regional comparisons across the state.
The 10 indicators that comprise the Index are: affordable rent; air quality; broadband access; clean drinking water; college and career technical education (CTE) certifications; early childhood education; homeownership; income above the cost of living; prosperous neighborhoods; and, short commutes. The composite California Dream Index score is based on all ten indicators. Key highlights from the 2019 data release include:
- Overall Score: The overall California Dream Index score made modest gains in every region of the state between 2018 to 2019. The Sierra Nevada and Central Valley regions saw the greatest gains in that year.
- Affordable Rent: Despite a decade of economic growth, the percent of Californians that have affordable rent has stagnated, with only 44% of renters paying less than 30% of their income on rent in 2019. Inversely, in the Bay Area, San Francisco County saw the highest increase in people paying affordable rent with a gain of 21% from 2010 to 2019.
- Broadband Access: The Index also shines a light on racial disparities and the ongoing work to redress them. In 2010, California Latinos had 29% lower broadband adoption than the state as a whole. Since then, there has been marked progress. In 2019, Latinos had 83% broadband adoption, compared to 87% for the state as a whole, yet more needs to be done to close the digital divide and ensure affordable broadband is made available in underserved urban, rural and tribal areas of the state.
- Clean Drinking Water: The Central Valley lags the rest of the state in access to clean drinking water, and many counties show declining progress as more state testing ramps up as part of California’s Human Right to Water
- College and CTE Certifications: All of California’s racial and ethnic groups saw continued progress in college attainment in 2019.
- Home Ownership: The percentage of Californians who own their primary residence has seen a steady decline of 5% from 2010 to 2019.
- Prosperous Neighborhoods: When comparing 2010 to 2019, more Californians lived in neighborhoods that had more than 20% of the population living in extreme poverty. Los Angeles County, the Central Valley region and the Inland Empire saw the greatest progress from 2018 to 2019, each seeing an over 5% gain in the number of residents living in low-poverty neighborhoods.
- Short Commutes: Overall, the state saw a nearly 11% increase in average commute times, indicating the deepening housing crisis that forces many to live further away from their source of employment.
The index consists of three parts: A tool for comparing key indicators, a portal linking to granular region- and issue-specific indices, and a robust community of practice focused on creating evidence-based public policy that address the state’s most pressing challenges.
To use the tool and get involved in the community of practice please visit: www.cafwd.org/california-dream-index.

