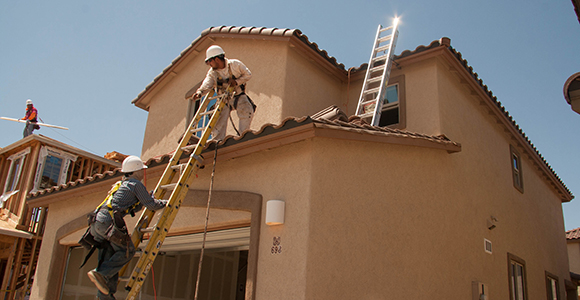
(Photo Credit: NIOSH/Flickr)
The Legislative Analyst’s California’s High Housing Costs: Causes and Consequences explicitly lays the blame for the state’s unaffordability crisis on inadequate housing production. While the problem is most acute in coastal regions, high housing cost burdens exist in every part of the state.
Price relief through “filtering” of increased housing supply will take time however. In the meantime, nearly 40 percent of California blue-collar construction workers (BCCWs) are low-income workers earning less than two-thirds the area median income. Today, the statewide median annual wage for a BCCW is approximately $35,000, with that median sinking to $30,000 in Los Angeles County, according to U.S. Census Bureau survey data.[1]

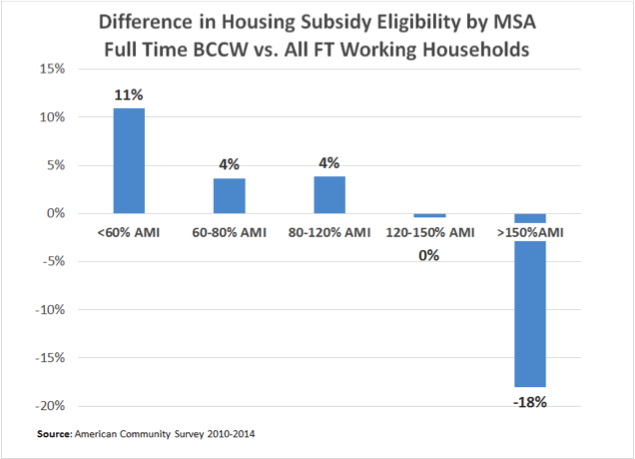
Housing affordability is a problem for BCCWs throughout the state. While only about 25 percent of statewide households with a full time worker qualify for tax credit based low-income housing subsidies (under 60 percent AMI) or inclusionary units (between 60 percent & 80 percent AMI), that figure rises to 40 percent for full-time BCCW households. In the five largest metros, containing about four-fifths of California’s population, that proportion rises to 42 percent. In the state’s two wealthiest metros – San Jose and San Francisco – 55 percent and 48 percent, respectively, of BCCW households qualify for housing subsidies.
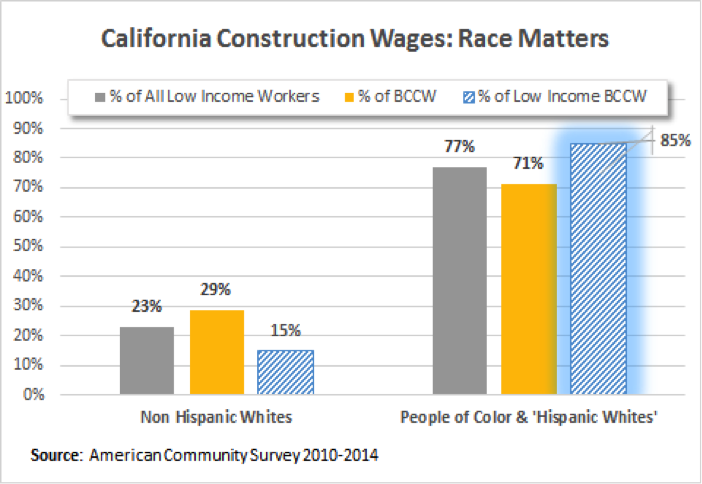
Race is both a defining characteristic of the blue-collar construction workforce and a dividing line for workers’ well-being. Statewide, non-whites make up more than seventy percent of BCCWs and comprise 85 percent of the low-wage construction workers. Latinos, who make up two-thirds of California BCCWs, saw annual wage income of slightly less than two-thirds of that of white BCCWs ($35,800 vs. $55,300). Controlling for skill, lesser-skilled Latinos make about $0.70 on the dollar compared to lesser-skill Whites; more-skilled Latinos make $0.68 on the dollar compared to more-skilled whites. There are similar disparities for other non-white BCCWs.
Union apprenticeships and membership substantially elevate wages of Hispanics and African Americans. Union membership is associated with greater Latino wage gains than those associated with a high school degree, citizenship, or a more skilled construction occupation.[2] Over eighty percent of apprentices enrolled in the Carpenters Training Center for Northern California are people of color.
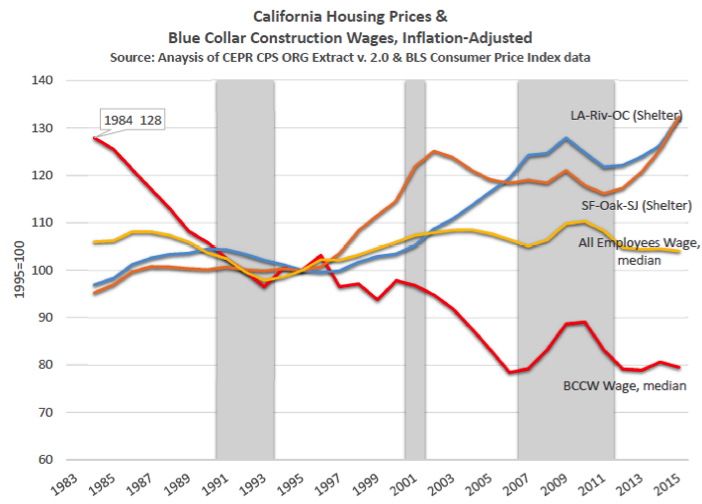
Trends over the past generation suggest that markets will not take care of a dramatically widened gap between BCCW wages and California housing costs. Since 1984, “real” (inflation-adjusted) BCCW wages have declined almost 40 percent. Inflation-adjusted housing costs have gone up by that same percentage, far exceeding the rise in construction costs, as shown in the LAO March 2016 report.[3] Real construction wages declined during the mid-2000’s housing boom, and they average real BCCW wages have been stagnant since industry growth restarted in 2011.
Given that construction worker payroll growth has lagged industry price & profit growth, the housing industry has room to absorb wage increases for the men and women building the housing. Incorporating wage standards into a housing development streamlining package can boost overall supply while helping to close the affordability gap for hundreds of thousands of families without any additional public subsidy.
READ PART 1: California’s Housing Crisis, Construction Labor, & the Costs of Multi-Family Housing
Alex Lantsberg, AICP, is research-analyst and Scott Littlehale is senior research-analyst for the Northern California Carpenters Regional Council, which includes 24 local unions throughout the 46 Northern California counties that represent tens of thousands of construction worker households.
Comments? Questions? You can email the authors at alantsberg@smartcitiesprevail.org and slittlehale@nccrc.org
[1] Author’s calculations US Census Bureau of American Community Survey 2010-2014 microdata; IPUMS-USA, University of Minnesota, www.ipums.org.
[2] Based on regression analysis of U.S. Census Current Population Survey public use microdata, via the Center for Economic Policy Research.
[3] See Figure 6, http://www.lao.ca.gov/reports/2015/finance/housing-costs/housing-costs.aspx